Claude Trading: An MT5 Indicator to Save My Account (Ep. 3)
Claude trading on gold: $1,831 away from losing my prop firm account, I built an MT5 indicator where Claude draws zones, stop loss, targets and lot size.
On Wednesday night, my prop firm account was $1,831 away from being closed. To climb back without repeating the week's mistakes, I built AI Zones today: a MetaTrader 5 indicator that shows the sell and buy zones on gold analyzed by Claude every 15 minutes, with the stop loss, targets and position size already calculated. It is a Claude trading tool that never places an order.
This is episode 3 of my $300,000 account journal, after episode 2 on the max drawdown. You will see where I am starting from, why I chose an indicator over a new strategy, how Claude produces the zones, the two zones from September 25 with their lot sizes, and the tool's limits.
Key facts
- On the evening of Wednesday, September 23, I had $1,831 left before the account would close (floor at $282,000). Friday evening: $287,043.98, or $5,043.98 of room.
- Week of September 21 to 25: −$3,473.75 over 24 trades (11 winners), but +$3,212.75 since Wednesday's low.
- AI Zones is an MT5 indicator: Claude analyzes gold (XAUUSD) every 15 minutes, for about 4 cents, and draws 1 to 4 zones with stop, targets and lot size.
- Lot size is set so a stop-out loses $700: with $5,044 of room, that leaves 7 stops in a row before the account closes.
- First day with the indicator: −$144 over 5 trades with 3 winners, the first day of the week without a big loss. The zones have not been backtested yet.
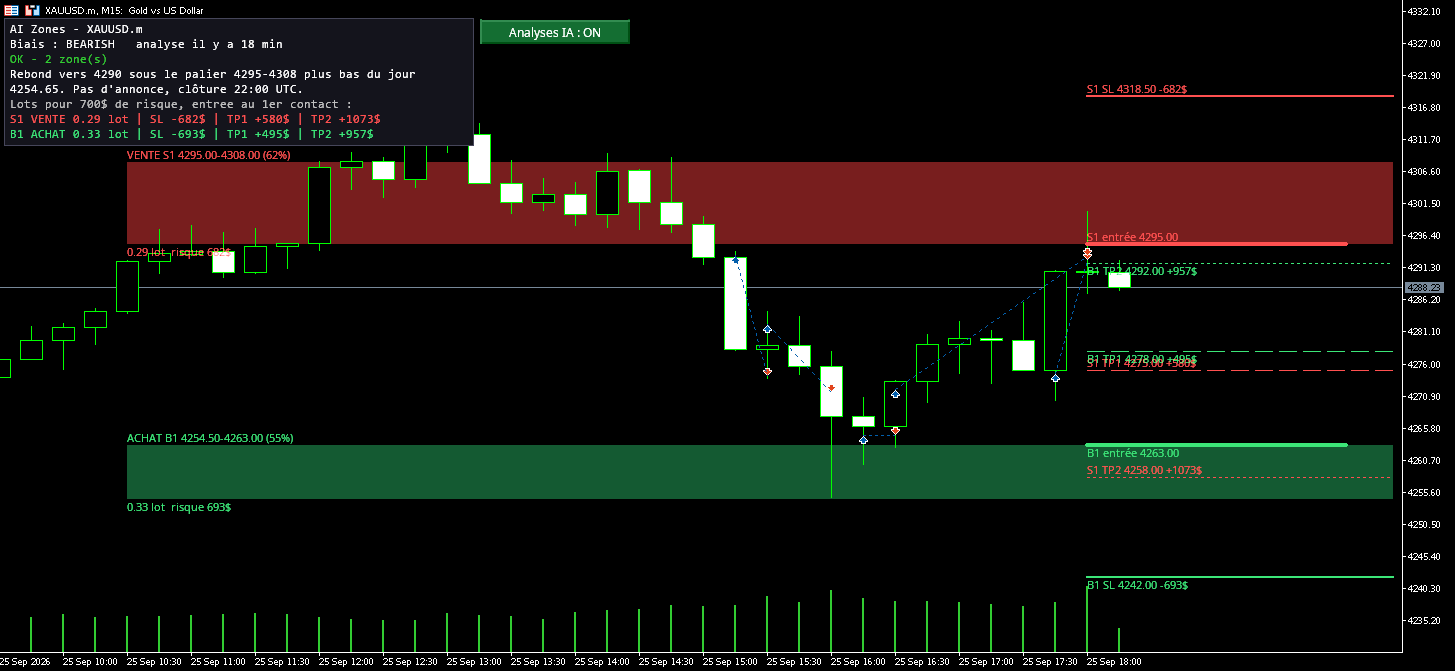
Gold on the 15-minute chart on Friday, September 25, captured at 18:21 MT5 server time. In red, sell zone S1; in green, buy zone B1. Top left, the panel shows lot sizes and dollar amounts; next to it, the button that turns the analysis on or off. The chart labels are in French.
Where I am starting from: $1,831 from closure
My prop firm account started on September 4 at $300,000, and it closes if the balance drops below $282,000, a 6% loss. After a high of $302,057 on September 14, the week of September 15 to 18 cost me $11,539, including one day at −$6,142.
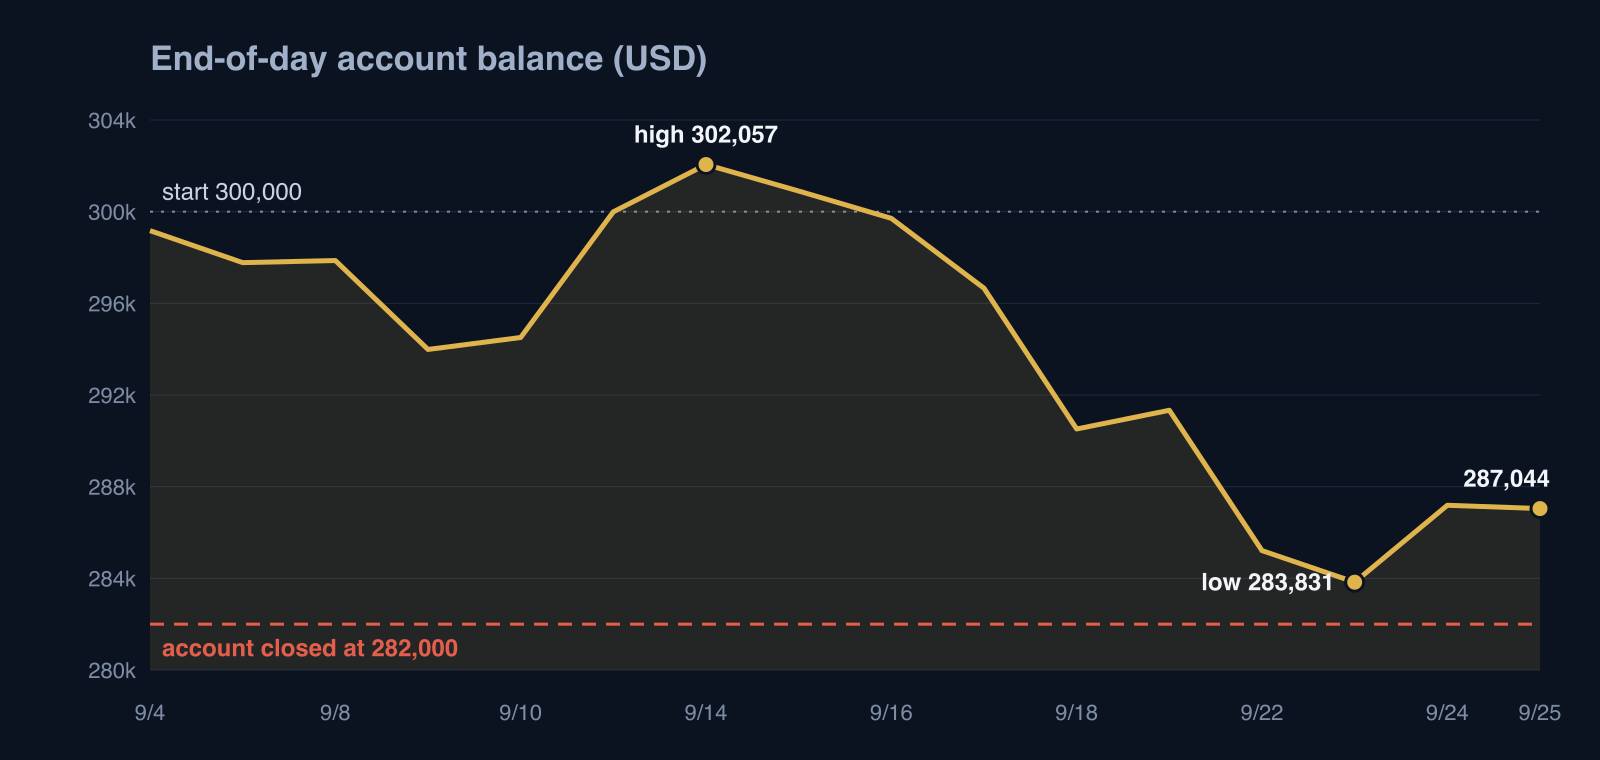
This week started at $290,518. Tuesday hurt almost as much as the previous Friday, and by Wednesday night I had only $1,831 of room left before closure. I have been climbing back since.
| Day | Result | Trades | Winners | Evening balance | Room above $282,000 |
|---|---|---|---|---|---|
| Mon 21 | +$816.00 | 1 | 1 | $291,333.73 | $9,333.73 |
| Tue 22 | −$6,124.50 | 8 | 3 | $285,209.23 | $3,209.23 |
| Wed 23 | −$1,378.00 | 6 | 2 | $283,831.23 | $1,831.23 |
| Thu 24 | +$3,356.75 | 4 | 2 | $287,187.98 | $5,187.98 |
| Fri 25 | −$144.00 | 5 | 3 | $287,043.98 | $5,043.98 |
| Week | −$3,473.75 | 24 | 11 |
Net results by trade closing day, commissions included. Since Wednesday's low: +$3,212.75.
When I look at the days that hurt the most (−$6,142 on the 18th, −$6,124.50 on the 22nd), they were not impossible markets. They were days where I chained entries, with sizes decided on the spot. A single day like that today would wipe out my remaining room.
Why an indicator instead of a new strategy
I did not need one more signal: I needed a framework. AI Zones does not guess where gold is heading, but it forces three things on me that I could not hold on my own.
- Prepared entries. I no longer enter anywhere: I wait for price to reach a zone drawn in advance, with its stop already set.
- A loss fixed before entering. The lot size is calculated for a chosen amount. At $700 per trade, a −$6,000 day would take 9 stops in a row.
- The right to do nothing. When there is no zone near price, there is no trade.
The math is still tight: with $5,044 of room, $700 per trade leaves me 7 stops in a row before closure. At $400, it would be 12. The amount is a setting in the indicator, and it is the first one I watch.
Today, the first day with the indicator, I finished at −$144 over 5 trades with 3 winners. It is far too early to conclude anything, but it is the first day of the week without a big loss.
Built in one day, one problem at a time
AI Zones did not exist this morning. Each part of the indicator answers a problem I ran into while trading, in the order I ran into it:
- A zone drawn by hand. Late in the morning, I drew my sell zone between 4,325 and 4,330. Then I wanted my zones to rest on levels I could check (high and low of the day, the previous day, the week, today's releases) rather than on my impression.
- Claude reads the market for me. A program sends it the candles and the calendar, and the indicator draws its answer. On the first try, the chart was readable, but messy.
- One color per zone. With several zones, I no longer knew which stop went with which entry. Each zone now has its own color, used by its stop and targets.
- Calculated lot sizes. My biggest losses came from sizes decided on the spot. The indicator shows the lot size and the dollar amount before I enter.
- The entry point marked. A thick line shows the price the lot size, stop and targets are calculated from.
- No more alert pop-ups. They covered the screen while I was placing orders. I turned them off.
- Stable zones. A zone that changed name or price every 15 minutes made me hesitate at the moment of entry. They no longer move without a reason.
- An ON/OFF button. Each analysis costs a few cents. I only pay when I am in front of the screen.
Claude trading as a decision tool, not a trading bot
AI Zones does not trade: it displays zones, and I make the call and click. That is the difference between a decision-support tool and a trading bot, which places orders on its own. Here the AI reads the market and suggests; execution stays manual.
What the MT5 indicator shows on the chart
Each zone has its own color, and everything tied to it uses that color: its stop, its targets, its labels. Sells are in reds and oranges, buys in greens and blues. I wanted a chart I could read in two seconds.
- Sell zone: the rectangle covers the range to sell in. Title: direction, name, bounds and confidence score.
- Buy zone: same idea in green. Under the rectangle, the suggested lot size and the dollar risk.
- Reference entry: thick line at the first edge price reaches, the bottom of a sell zone, the top of a buy zone.
- Stop loss (SL): solid line. The label shows the price and the dollar loss.
- Target 1 (TP1): dashed line. The label shows the price and the dollar gain.
- Target 2 (TP2): dotted line, only when a second target exists.
- "AI analysis" button: stops or restarts the calls to Claude, right from MT5.
Stops and targets are only drawn from the time of the analysis onward. The history stays readable, and the labels sit at the start of the lines, next to the latest candles.
How Claude analyzes gold every 15 minutes
The indicator does not think for itself: it reads a file. A small program runs next to MT5 and prepares that file every 15 minutes, in five steps.
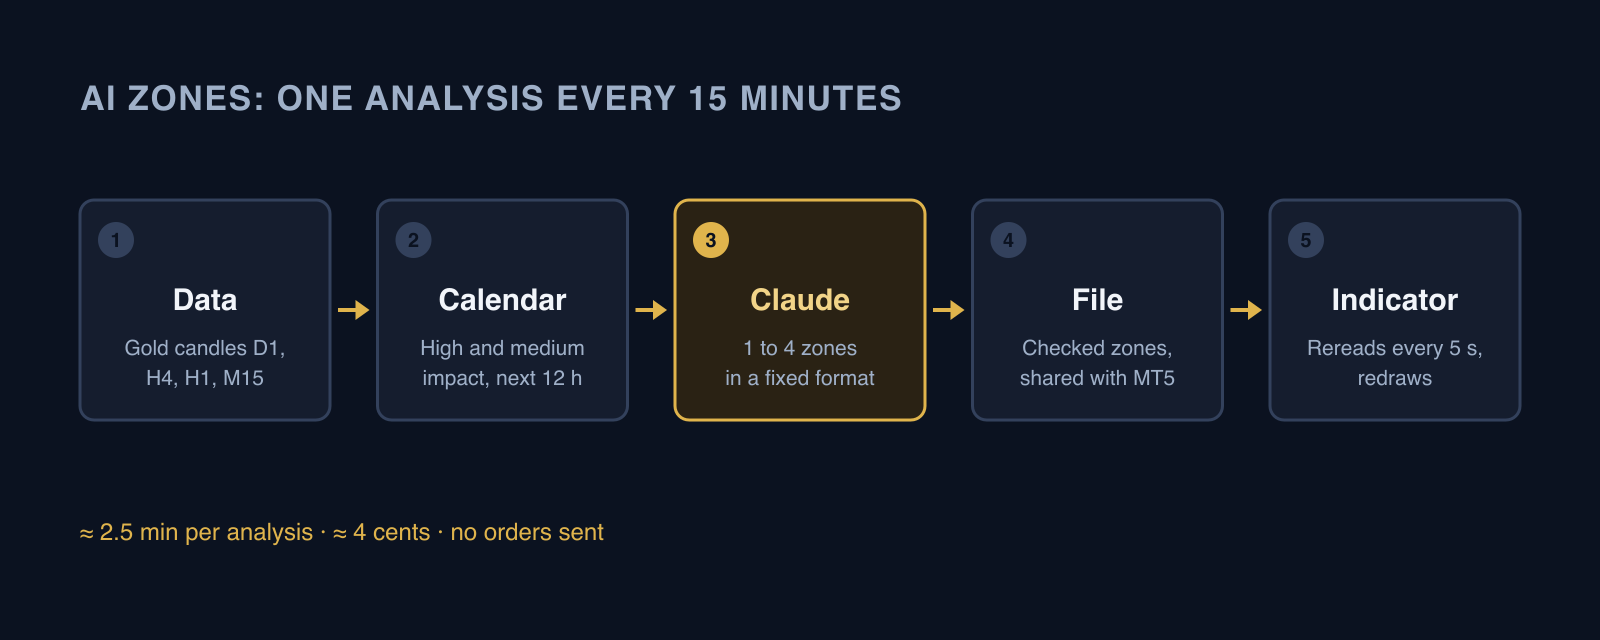
- The data: D1, H4, H1 and M15 gold candles, current price, average volatility.
- The calendar: high and medium impact releases for the next 12 hours.
- Claude: it finds 1 to 4 zones where several levels overlap, and answers in a fixed format.
- The file: the zones are checked, then written to a file shared with MT5.
- The indicator: it rereads the file every 5 seconds and redraws if anything changed.
One analysis takes about two and a half minutes and costs roughly 4 cents. Over a full market day, that is under $4. The button is there so I can switch it off when I am away from the screen.
Zones that do not move for no reason
Claude now receives the zones already on the chart and the time they were created. For each one it has to choose: keep it as is (the program then copies the old numbers to the cent), adjust it if something new moves the level, or remove it and give the reason.
It was not like that at first. The first versions had an annoying flaw: every analysis, Claude started from scratch. The same sell zone became "z1", then "sell-high-jour", then "Z2", with bounds shifted by a dollar or two. There was no way to tell whether a zone had disappeared because it was invalidated or just because it had been renamed.
This afternoon, a buy zone was removed with this reason: "price fell to 4,273.46, below the SL at 4,274: zone invalidated". A zone that price has entered stays on the chart until either its stop or its first target is hit.
Today's XAUUSD zones and the lot size math
On September 25, Claude drew a with-trend sell (S1, 62% confidence) and a counter-trend buy (B1, 55%). Gold had broken the previous day's high (4,303.26) and topped out at 4,315.73, the high of the day, then fell to 4,254.65 before bouncing back toward 4,290. The broader trend has been down since the 4,399 peak on September 18.
| Zone | Range | Entry | SL | TP1 | TP2 | Confidence |
|---|---|---|---|---|---|---|
| S1 sell | 4,295.00-4,308.00 | 4,295.00 | 4,318.50 | 4,275.00 | 4,258.00 | 62% |
| B1 buy | 4,254.50-4,263.00 | 4,263.00 | 4,242.00 | 4,278.00 | 4,292.00 | 55% |
S1 is the 4,295-4,308 shelf, rejected several times today just under the high of the day. B1 sits between the low of the day and the previous day's low, where price bounced hard. It is a counter-trend buy, and Claude says so in its comment: that is also why its confidence is lower.
Gold lot size, zone by zone
For each zone, the indicator calculates the lot size that loses a fixed amount if the stop is hit. I set it to $700. The math starts from the first edge price reaches, where the stop is farthest away: if I enter deeper in the zone, I risk less than planned, never more. Lot sizes are rounded down.
| Zone | Lot | Stop hit | TP1 hit | TP2 hit |
|---|---|---|---|---|
| S1 sell | 0.29 | −$682 | +$580 | +$1,073 |
| B1 buy | 0.33 | −$693 | +$495 | +$957 |
On gold, 1 lot is 100 ounces: every $1 move is worth $100 per lot. For S1, the stop is $23.50 from the entry: 700 ÷ (23.50 × 100) = 0.297, rounded down to 0.29 lot, which is a $682 loss if the stop is hit. It is what a gold lot size calculator does, run automatically for every zone.
Safeguards and limits of the tool
AI Zones displays, it does not act, and it flags on its own when its information is no longer reliable. These are the rules I set for it.
- No orders. The indicator and the program only display. The decision and the click stay mine.
- Inconsistent zones grayed out. A buy zone with its stop above the zone, for example, shows in gray with the word "INCOHERENT" and triggers nothing.
- Stale analysis flagged. After 20 minutes without an update, the panel turns red. When I have switched analysis off with the button, it shows how long the zones have been frozen.
- No weekends. No zone runs past Friday 22:00 UTC, and no analysis runs while the market is closed.
- No pop-ups. Full-screen alerts are off by default.
To stay clear of news releases, the rest of my lab runs on the Forex Calendar Pro economic calendar (my own service, introduced in episode 1).
The percentage next to each zone is Claude's judgment of how many levels overlap and how clean they are. It is not a measured probability: a 62% zone does not win 62 times out of 100.
These zones have not been backtested yet. AI Zones shows me where to watch price; it is not a signal to follow blindly.
Getting AI Zones
AI Zones is available for €500. It runs on MetaTrader 5 and requires your own Claude API key (Anthropic): analyses are billed directly to that account, about 4 cents each based on my usage. The indicator displays zones and calculates lot sizes; it places no orders, has not been backtested and guarantees no results. To get it, email me at wdltradingapi@gmail.com.
FAQ
How do you avoid losing a prop firm account?
In my case, by fixing the loss before entering and counting the stops I have left. With $5,044 of room above the $282,000 floor, $700 of risk per trade leaves 7 stops in a row before closure, versus 12 at $400. My worst days came from chained entries with sizes decided on the spot.
Can you use Claude for trading?
Yes, as an analysis tool. In AI Zones, Claude receives the D1, H4, H1 and M15 gold candles and the releases for the next 12 hours every 15 minutes, then suggests 1 to 4 sell or buy zones. It places no orders: I make the decision and click myself in MT5.
How much does it cost to run Claude on the market every 15 minutes?
For AI Zones, about 4 cents per analysis, for roughly two and a half minutes of processing. At one analysis every 15 minutes, that is under $4 for a full market day. A button in MT5 turns the analysis off when I am away from the screen. The indicator itself sells for €500, and a Claude API key is required.
Can Claude place trades in MT5?
Not in AI Zones. A trading bot can place orders on its own, but here the indicator and the program only display the zones, stop, targets and lot size. I made that choice on purpose, because these zones have not been backtested yet and the decision should stay mine.
How do you calculate lot size on gold?
On gold, 1 lot is 100 ounces, so a $1 move is worth $100 per lot. The formula is: lot size = accepted risk ÷ (stop distance in dollars × 100). With $700 of risk and a $23.50 stop, you get 0.297, rounded down to 0.29 lot, which is a $682 loss if the stop is hit.
Is an AI confidence score a probability?
No. In AI Zones, the percentage is Claude's judgment of how many levels overlap and how clean they are. A 62% zone does not win 62 times out of 100, and the zones have not been backtested yet. The tool tells me where to look, not what to trade blindly.
Going further: LLM trading on gold, Jev vs Claude vs plain Python.
All episodes of the journal are collected on the blog.
This article is not investment advice. Trading on margin carries a high risk of losing capital.
This content reflects personal experience and is not financial advice. Trading leveraged products carries a high risk of losing money.
Never get caught by a news spike again
Get every high-impact economic event in real time via API or Telegram.
See pricing